Before You Begin
Purpose
In this tutorial, you learn how to use an Interactive Grid created in Oracle Application Express 5.1.
Time to Complete
Approximately 50 minutes.
Background
Oracle Application Express (Oracle APEX) is a rapid web application development tool for Oracle Database. Using only a web browser and limited programming experience, you can develop and deploy professional applications that are both fast and secure. Oracle Application Express is available with Oracle Database, whether it's on-premises or in an Oracle Database Cloud Service.
In this tutorial, you learn how to use the various options provided by an Interactive Grid developed using Oracle Application Express Release 5.1. An interactive grid presents users a set of data in a searchable, customizable report. Functionally, an interactive grid includes customizations capabilities available in interactive reports plus the ability to rearrange the report interactively using the mouse. In an editable interactive grid, users can also add to, modify, and refresh the data set directly on the page.
Please keep in mind the following while running this tutorial:
- Logging into your Oracle Application
Express workspace: Your Oracle
Application Express workspace may reside in an
on-premises Oracle Database or in Oracle Database
Cloud Services. The login credentials differ
depending on where your workspace is located:
- Logging into Oracle Application Express in a Oracle Database Cloud Service: Go to the Oracle Help Center for Cloud, and select Platform and Infrastructure. From here, select your Database Cloud Service and the Get Started page will appear.
- Logging in to Oracle Application Express on-premises: From your browser, go to the location of your on-premises installation of your Oracle Application Express workspace provided by your Workspace Administrator.
- Schema: If you are accessing an Oracle Application Express workspace in Database Schema Service, you have one schema assigned to you with a schema name that you cannot change. If you are accessing the workspace in an on-premises Oracle database, you may have more than one schema assigned to your workspace by the Oracle Application Express Instance Administrator.
What Do You Need?
Before starting this tutorial, you should:
- Have access to an Oracle Database 11g or later release, either on-premises or in a Database Cloud Service.
- Install Oracle Application Express Release 5.1 into your Oracle Database (for on-premises only). If you are using Oracle Database Cloud Service, the application is already installed for you.
- Provision at least one Oracle Application Express user. See Creating New User Accounts in Oracle Application Express Administration Guide.
Searching for Information in Your Interactive Grid
To examine how the Search bar works, log in to your Oracle Application Express workspace, either on-premises or in Oracle Database Cloud Service, and perform the following steps:
Installing a Packaged Application
Before performing any manipulations to an Interactive Grid, you need to create or import an application containing an Interactive Grid.To install a packaged application containing an Interactive Grid in Application Express 5.1, perform the following steps:
-
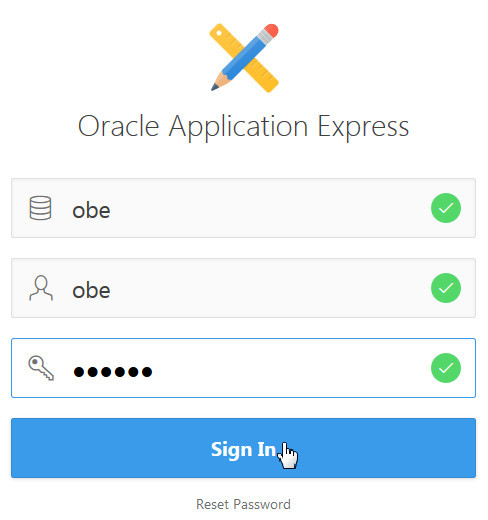
In the Application Express login page, enter the following login credentials and click Sign In:
-
Workspace: obe
-
Username: obe
-
Password: oracle
Description of this image -
-
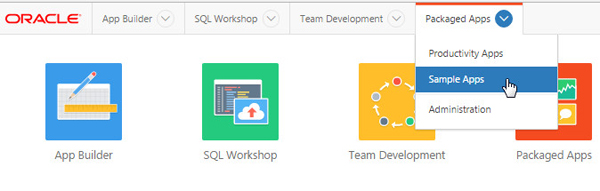
From the Oracle Application Express home page, click the down arrow next to the Packaged Apps tab, and select Sample Apps.
Description of this image -
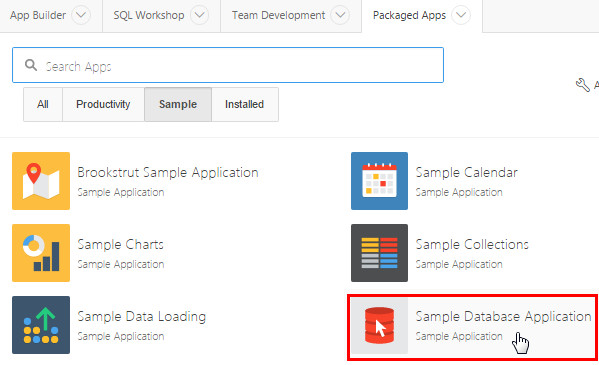
From the list of sample applications, select Sample Database Application.
Description of this image -
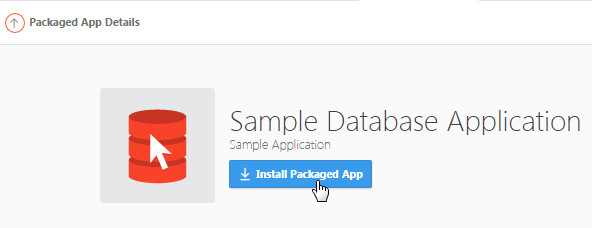
Click Install Packaged App to initiate the process of installing the sample application.
Description of this image -
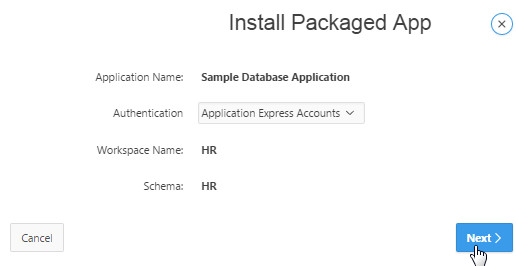
In the Install Packaged App window, accept the defaults and click Next>.
Description of this image -
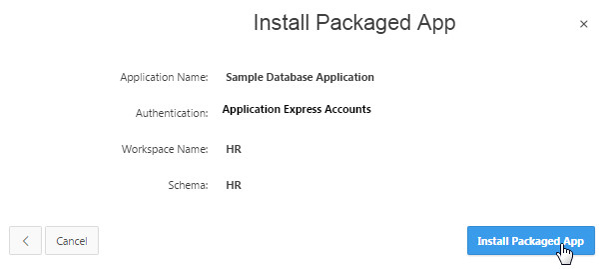
Click Install Packaged App. The application gets installed in your workspace.
Description of this image -
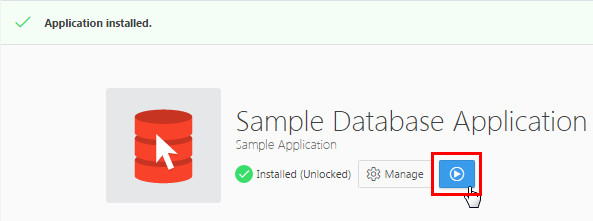
Click the Run icon to run the application.
Description of this image
Performing Search in an Interactive Grid
To perform search in an Interactive Grid, perform the following steps:
-
In the Sample Database Application home page, select Customers in the navigation menu.
Note: In case, you are executing this tutorial in On-Premises, a Log In screen appears. Enter your Oracle Application Express credentials, and click Log In to view the application's home page. Then, select Customers in the navigation menu.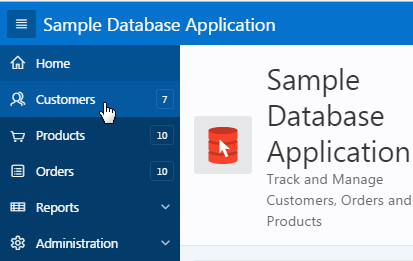
Description of this image -
In the Sample Database Application, Customers page is the only Interactive Grid. Other pages, such as, Products and Orders are Interactive Reports. In the Customers page, enter la in the Search bar, and click Go.
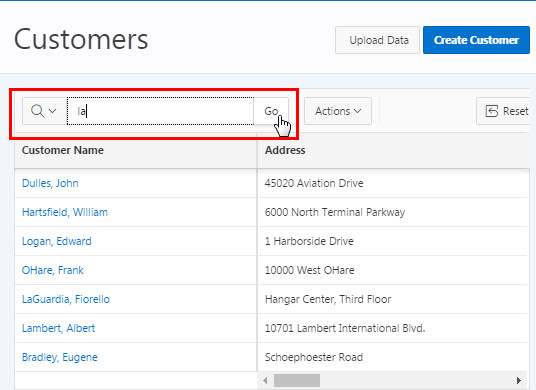
Description of this image -
The search is not case sensitive, so it finds 'la' in all text columns. In this case, the search returns three rows. It also displays the filter at the top of the grid.
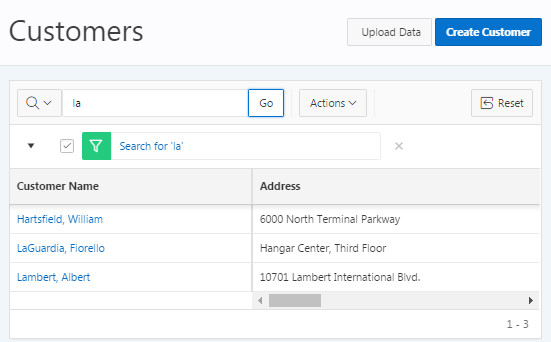
Description of this image -
To create another filter, enter william in the text area, and click Go.
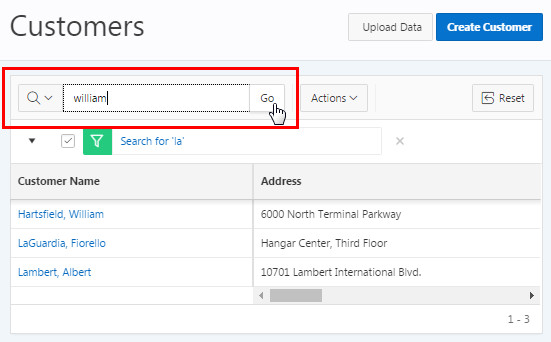
Description of this image -
Notice that the only one row is displayed in the grid, which means only one row met both the filter criteria.
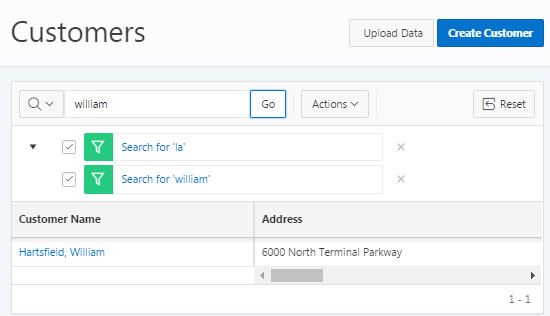
Description of this image -
You can remove a filter by clicking the Remove Filter icon shown beside it. Click the Remove Filter icon beside Search for 'la'.
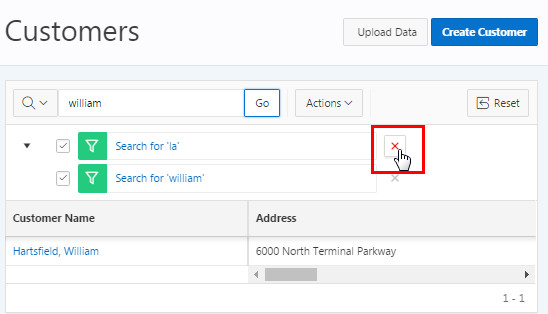
Description of this image -
Notice that only one filter is applied to the report now. Click the Remove Filter icon beside Search for 'william' to remove the other filter.
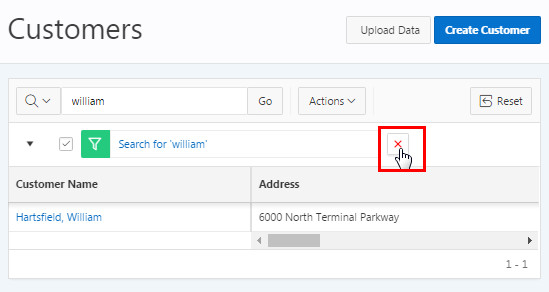
Description of this image -
Both the filters are removed, and the grid displays all rows.
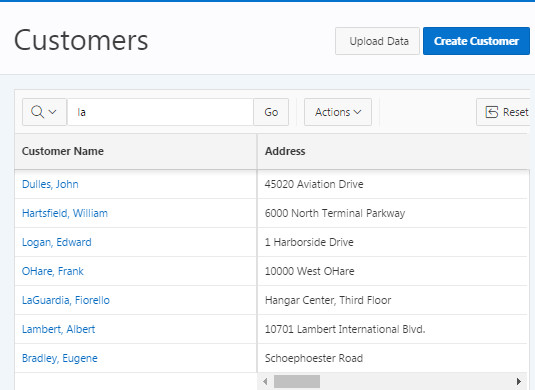
Description of this image -
You can create a filter for just a column by using the select columns icon. Click the Select Columns icon and select Address.
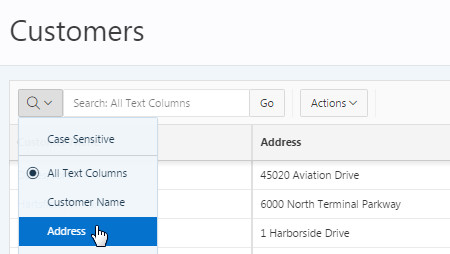
Description of this image -
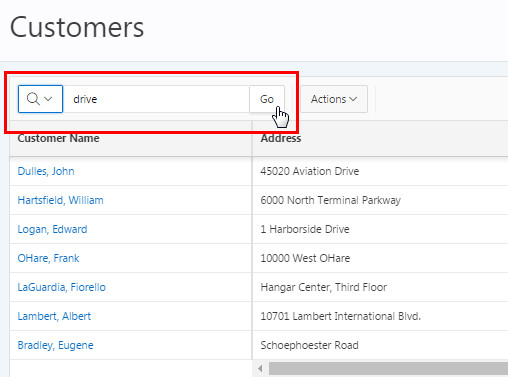
Enter drive in the Search bar, and click Go.
Description of this image -
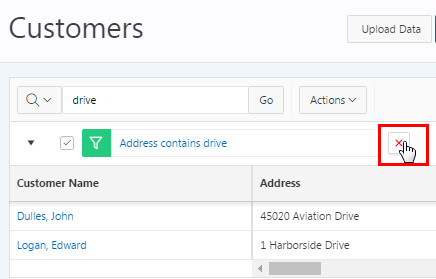
Notice the filter is created on Address and returns two rows because there are two rows which contain 'drive' in its Address. Click the Remove Filter icon beside 'address contains drive'.
Description of this image
Manipulating Your Interactive Grid using the Actions Menu
The Actions Menu contains many tasks that are
useful in manipulating your Interactive Grid. A few
default functions from the Actions Menu are exposed
in this example grid.
Note that for grids that you use within other
applications in your environment, the developer can
limit the functions available. Perform the following
tasks:
Changing Column Display
You can edit which columns to display and in what order you want to display them by selecting Columns in the Actions menu.
-
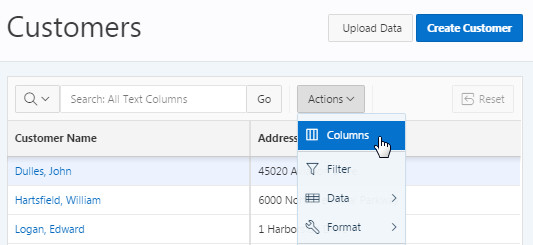
In the Customers page, click the Actions menu and select Columns.
Description of this image -
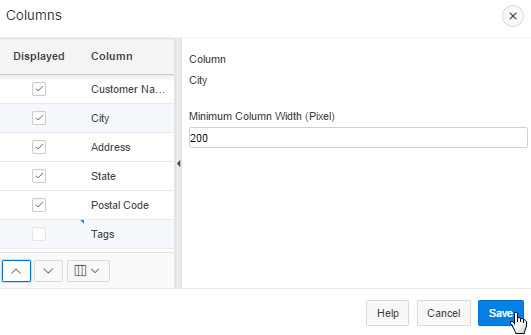
In the Columns dialog, uncheck Tags, select the City column, click the Move up button, update the Minimum Column Width (Pixel) value to 200, and click Save.
Description of this image -
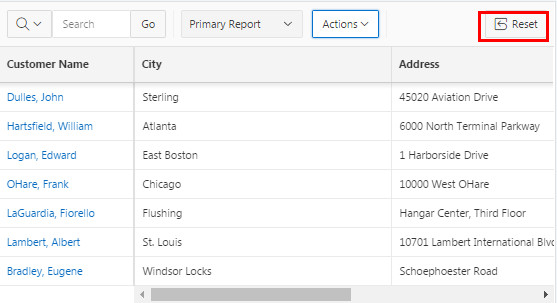
You see that the Tags column does not appear in the grid, the City column is displayed next to the Customer Name column, and the column width is reduced to 200 pixels. Click the Reset button to revert back the changes.
Description of this image
Adding a Column Filter
You can filter a column in an interactive grid with a specified operator and value. Perform the following steps:
-
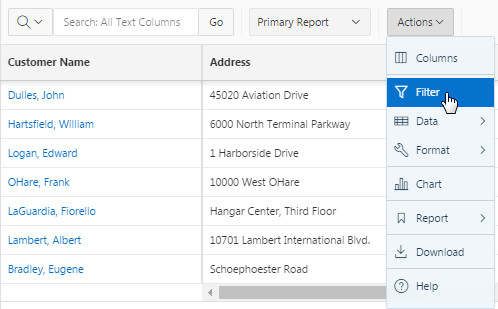
In the Customers page, click the Actions menu and select Filter.
Description of this image -
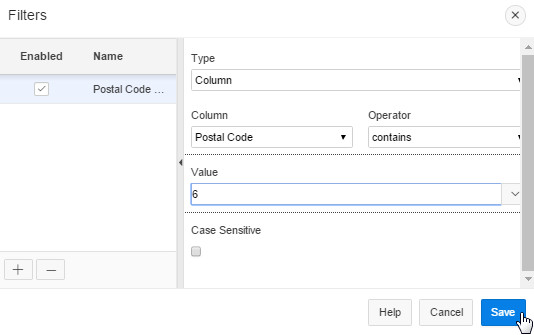
In the Filters dialog, select Postal Code as the Column, select contains as the Operator, enter 6 as the value, and click Save.
Description of this image -
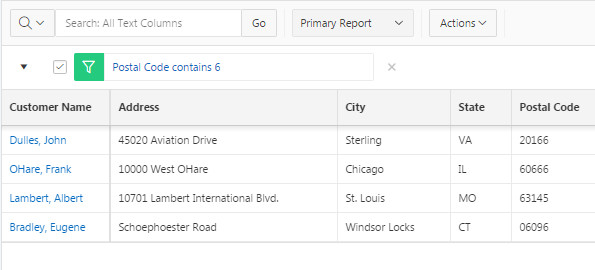
All customer records containing '6' in their postal code is displayed in the grid.
Description of this image -
Delete the filter by clicking the Remove Filter icon beside 'Postal Code contains 6'.
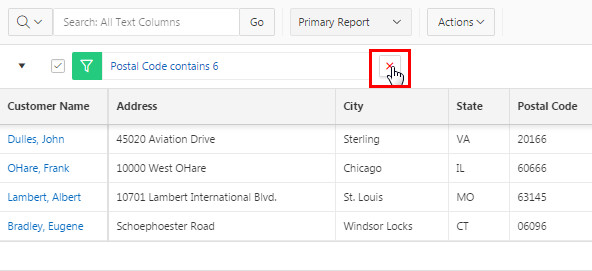
Description of this image
Sorting Columns
You can perform sorting (ascending or descending) of a column by selecting Sort on the Data submenu. You can also specify how to handle nulls (use the default setting, always display them first or last). Perform the following steps:
-
In the Customers page, click the Actions menu, select Data, and select Sort.
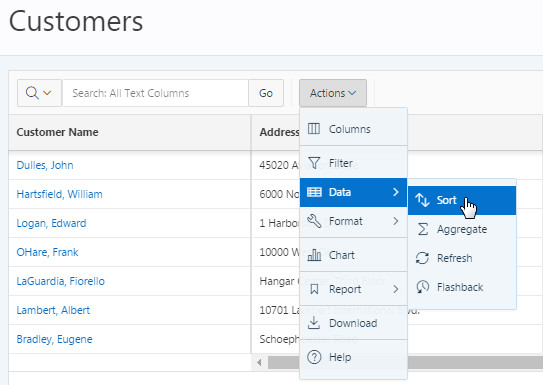
Description of this image -
In the Sort dialog, select City for Column, accept the default selections for Direction and Nulls, and click Save.
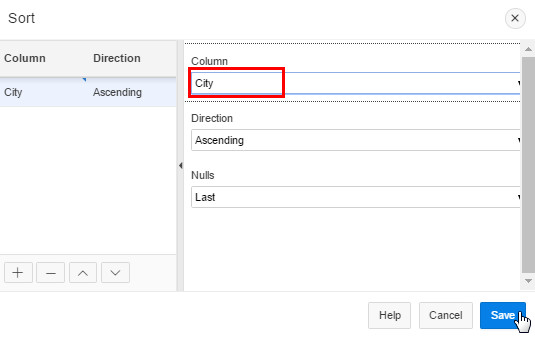
Description of this image -
You see that the grid is now sorted by City. The sort indicator is located next to the City column to indicate the sort column. The arrow indicates whether it is in ascending or descending order.
Note: To change the sort to descending order, you can click on the sort ascending icon in the header for City and it will change to sort descending.
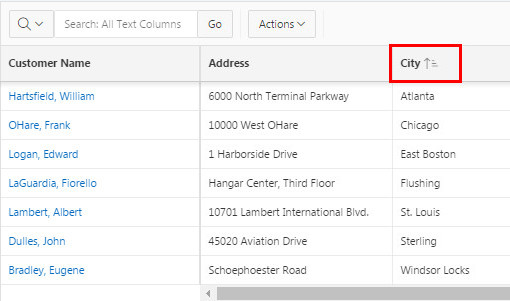
Description of this image
Adding Highlights
You can highlight specific rows or cells based on a filter by selecting Highlight in the Actions, Format submenu. The rows or cells that meet the filter criteria are highlighted using the characteristics associated with the filter. Perform the following steps:
-
Click the Actions menu, select Format, and then select Highlight.
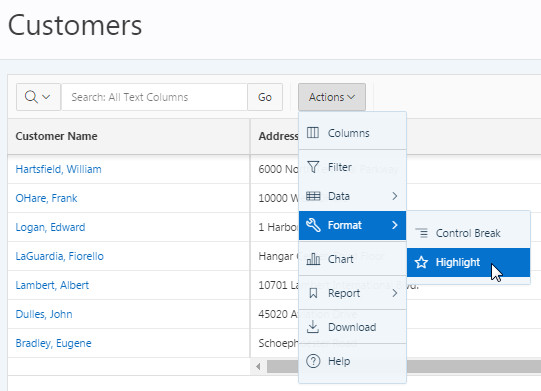
Description of this image -
To highlight all the repeat customers, In the Highlight dialog box, perform the following steps:
- Enter Repeat Customers for Name
- Select Row for Highlight
- Click Colors and choose Green for Background Color
- Click Colors and choose Red for Text Color
- Select Row for Condition Type
- Enter repeat customer for Search
- Click Save
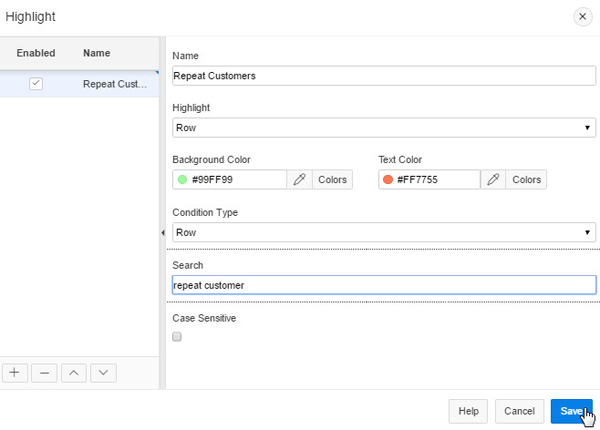
Description of this image -
You see all the repeat customers are highlighted in the grid. Click Remove Filter next to 'Repeat Customers' to remove the filter.
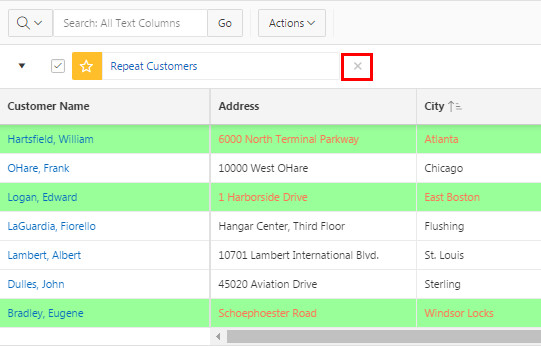
Description of this image
Creating a Control Break
The other way to group specific rows using a filter is by creating a control break. You can break an interactive grid by column by selecting Control Break in the Actions, Format submenu. Perform the following steps:
-
Click the Actions menu, select Format, and then select Control Break.
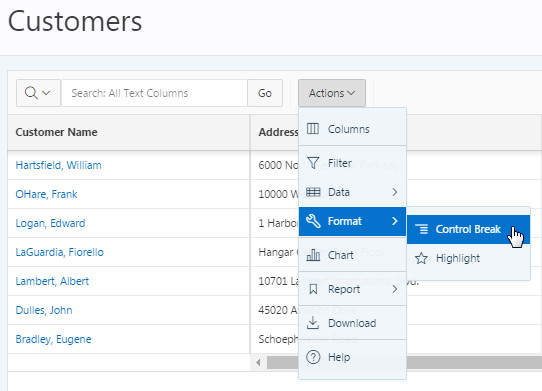
Description of this image -
To group all customers based on tags, select Tags under Column and click Save.
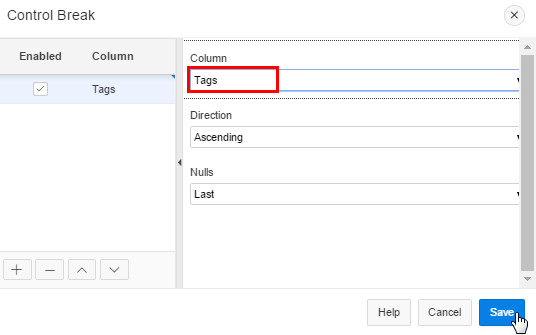
Description of this image -
You see that the control break is created and the Tags column is extracted from the grid. In this case, the grid now shows a list of customers based on tags.
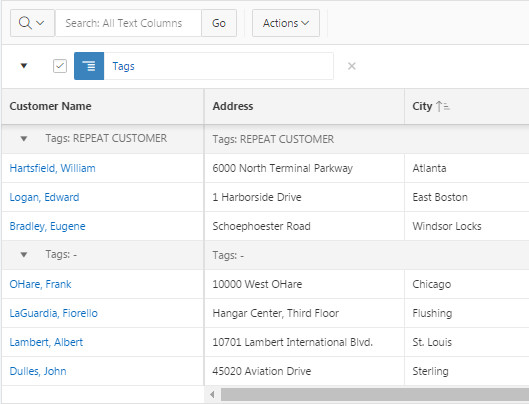
Description of this image
Saving Your Customized Interactive Grid as a Report
You can save your changes as a new report within the application. You can save a grid as a Public Report so that other authenticated users can see the report or you can save the grid as a Private Report that only you can view. If you log out, your changes will not be saved unless you have saved the grid. You can save multiple versions of a private or public reports and each one will appear in the list of reports. Perform the following steps:
-
Click the Actions menu, select Report, and then select Save As.
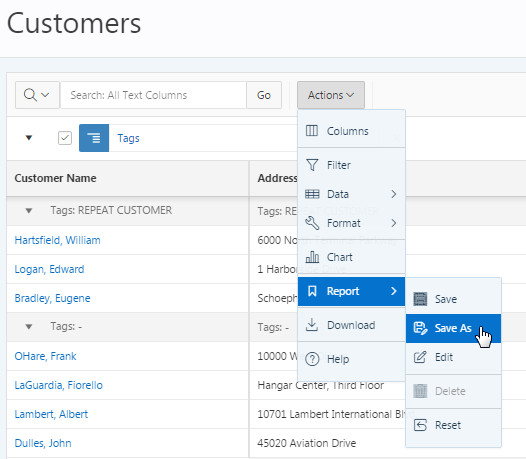
Description of this image -
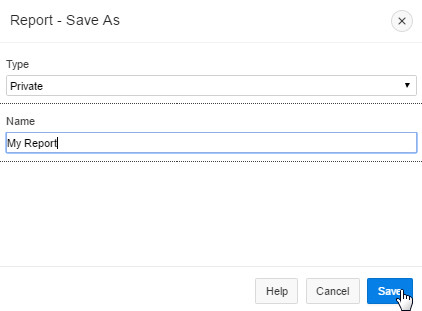
In the Report - Save As dialog box, make sure the Type is set to Private, enter My Report as the name of the report, and click Save.
Note: In this step, you are creating a private report called My Report. If another user logs into the application, that user will not see your private report. You can also create a Public report that can be accessed by all users by selecting Public as the type of report.
Description of this image -
A drop down list automatically appears with the report you just created being selected.
Description of this image
Downloading Your Customized Grid Report
You can obtain the data of an interactive grid as a CSV or HTML file by selecting Download in the Actions menu. Perform the following steps:
-
To download the private report that you created in the previous section, click the Actions menu and select Download.
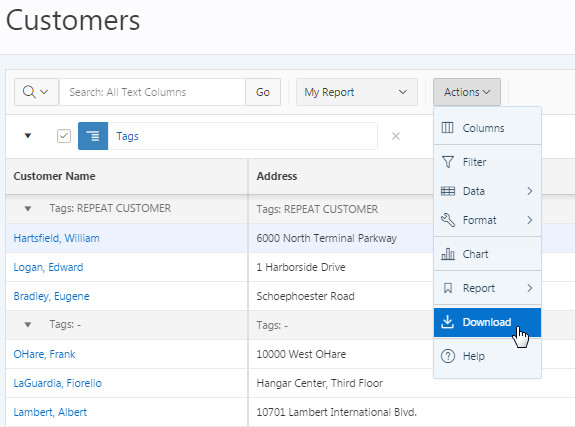
Description of this image -
In the Download dialog box, select the format as CSV and click Download. Notice that CSV is the default format to download a report. If you do not select a format and click Download, the report by default will be downloaded in CSV format.
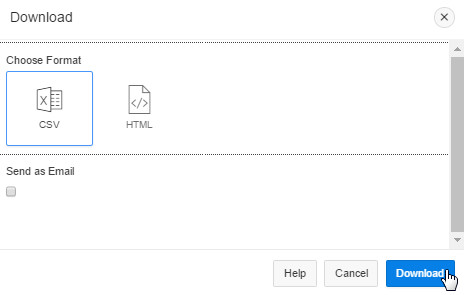
Description of this image -
The downloaded report in Microsoft Excel looks like this.
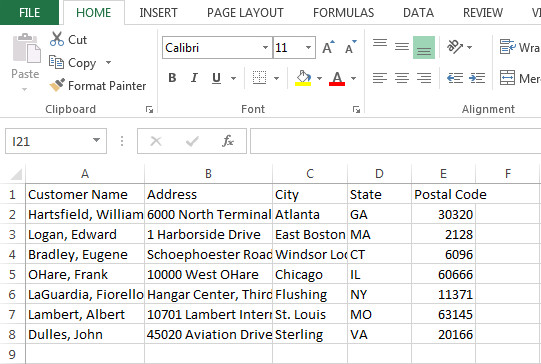
Description of this image Note: If you want to download the report in HTML format, in the Download dialog box, select the format as HTML and then click Download.
Emailing the Report
Apart from downloading, you can also email a report to one or more recipients. Perform the following steps:
-
Click the Actions menu and select Download.
Description of this image -
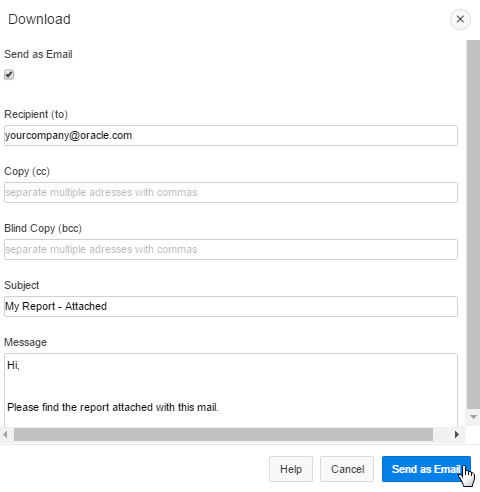
To email the file, select the check box Send as Email, complete the fields for the recipients such as, Address, Subject, and Message, and click Send as Email.
Description of this image
Reverting To the Previous State
You can revert an interactive grid to a specific point in time by selecting the Flashback option in the Interactive Grid. Perform the following steps:
-
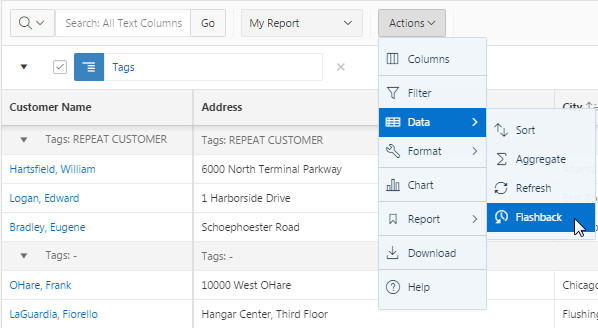
To revert your interactive grid by 10 minutes, click the Actions menu, select Data, and select Flashback.
Description of this image -
In the Flashback dialog box, enter 10 for minutes ago and click Save.
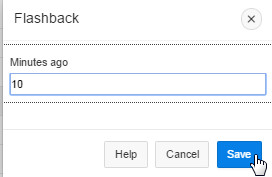
Description of this image The grid reloads to the state it was in 10 minutes ago.
Note: The screenshot for this step is not included as the Flashback option reloads your grid to a state that it was in 10 minutes ago.
-
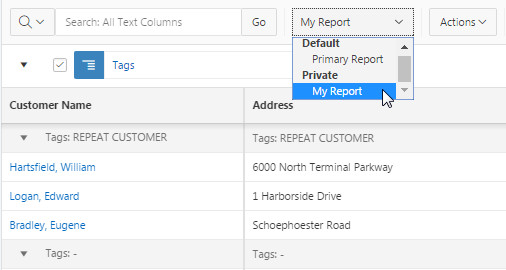
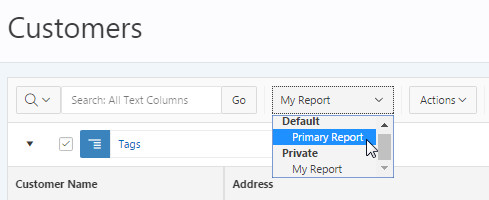
Under the list of reports, select Primary Report to navigate back to your primary grid.
Description of this image
Manipulating Your Interactive Grid using the Column Heading Menu
Clicking any column heading exposes a column heading menu. Some of the functions on the column heading menu can also be done using the Actions Menu. Perform the following steps:
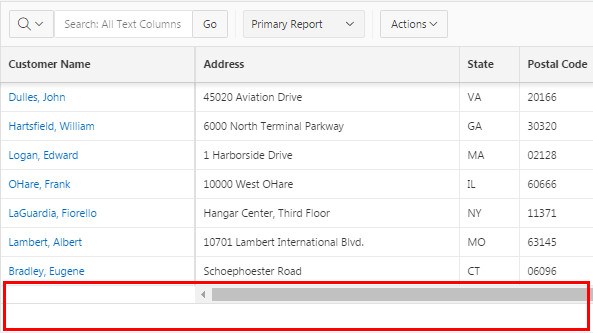
Resizing a Column
You can resize a column by clicking and holding the edge of a column heading and adjusting it with the mouse.
-
Place your mouse at the edge of the Address column and adjust the mouse to reduce the column size.
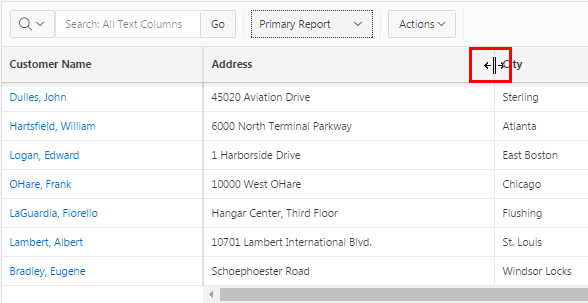
Description of this image -
The resized column looks like this.
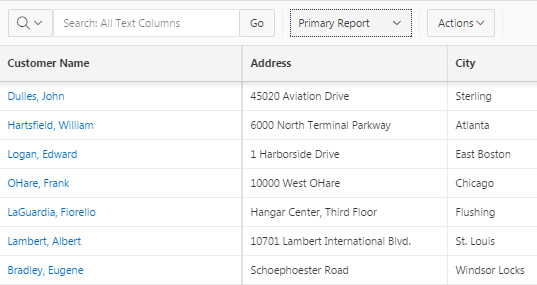
Description of this image
Rearranging Columns
You can rearrange a column by selecting the column you want to move, placing your mouse pointer at the start of the column header, and draging the column to the desired location.
-
Place your mouse pointer at the start of the Postal Code column. Click and drag the column after Customer Name and drop it.
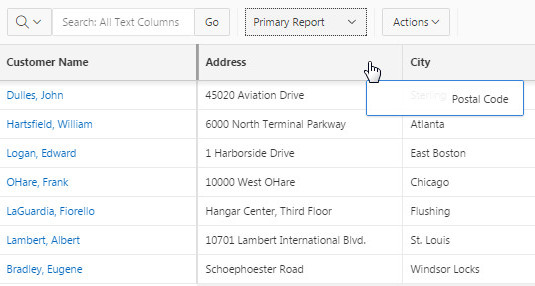
Description of this image -
The rearranged columns look like this.
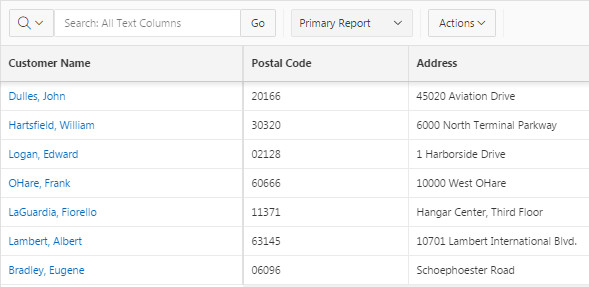
Description of this image
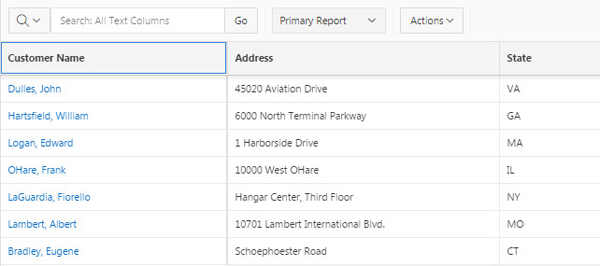
Sorting Columns
You can sort a column in ascending or descending order by hovering the mouse in the column heading you want to sort on and selecting the Sort Ascending or Sort Descending icon.
-
Hover your mouse on the Customer Name column and select the Sort Ascending icon.
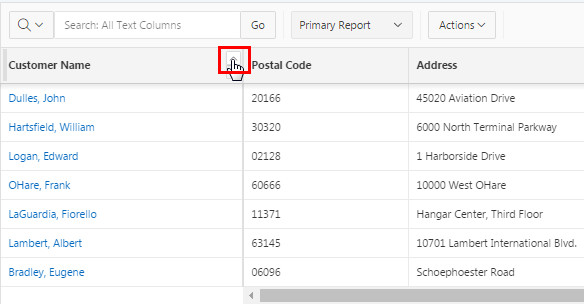
Description of this image -
The grid is sorted on the Customer Name column.
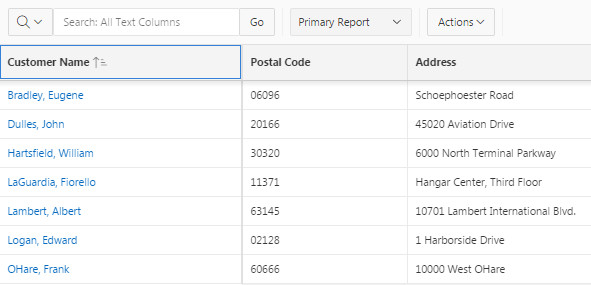
Description of this image
Creating a Control Break
You can create a control break by clicking the column header and selecting the Control Break icon. When control break is created, the column becomes a master record for the grid.
-
Select the Tags Header, and select the Control Break icon.
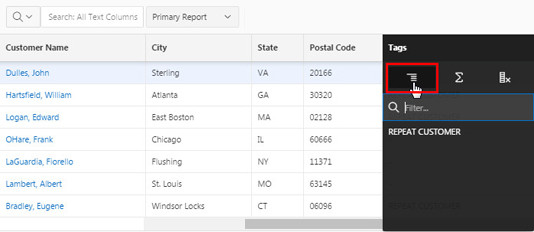
Description of this image -
The grid has a control break created on the Tags column. Click the Remove Control Break icon to remove the break.
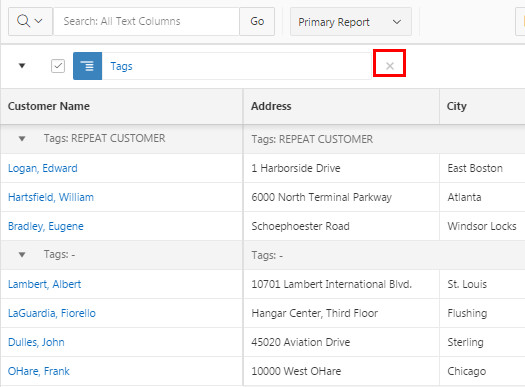
Description of this image
Hiding a Column
You can hide a particular column by selecting the Hide Column icon from the column header.
-
Select the City Header, and select the Hide Column icon .
Description of this image -
Notice that the City column no longer appears in the grid.
Note: To view the column in the grid again, use the Columns option from the Actions menu.
Description of this image
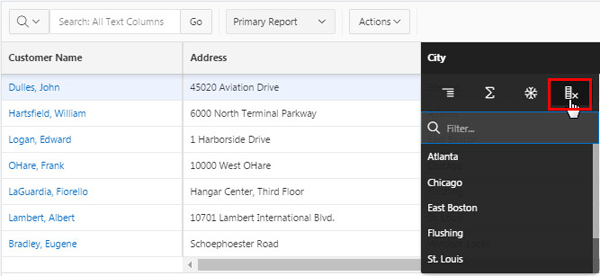
Freezing and Unfreezing a Column
You can select the column header link and then click the Snowflake icon to freeze and unfreeze a column. Freezing a column excludes it from the horizontal scrollable area and unfreezing a column includes it in the horizontal scrollable area.
-
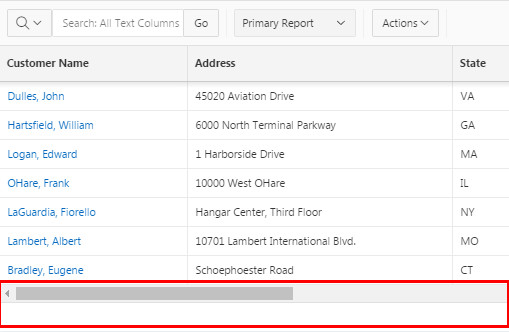
In your Sample Database Application, the Freeze option is already selected for the Customer Name column. Scroll the page to your right, you see that the Customer Name column is excluded from the scrollable area.
Description of this image -
Select the Customer Name column heading and click Unfreeze.
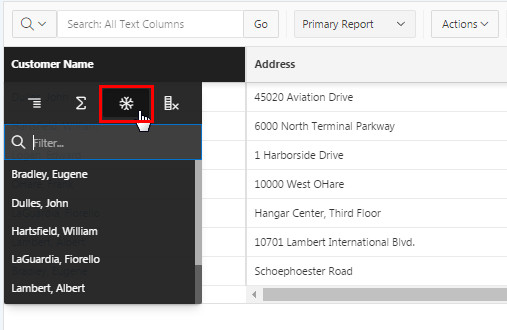
Description of this image -
The scroll bar resizes to fit the Customer Name column to its scrollable area.
Description of this image
Creating a Filter
You can filter an interactive grid by the contents of a column by entering keywords in the Search field of the Column Heading menu.
-
To filter the grid by the Address column, click the Address column header, Click within the Filter... text area and Enter Drive. Press Enter to execute the filter.
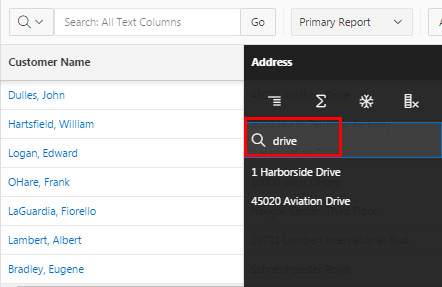
Description of this image -
The interactive grid redisplays with the filter applied.
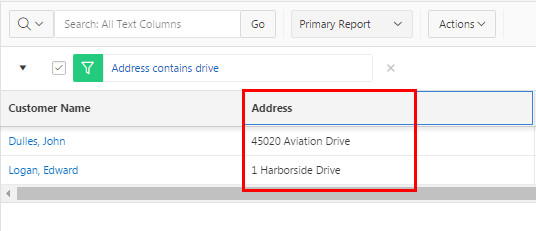
Description of this image