Before You Begin
Purpose
In this tutorial, you learn how to add charts to your existing database application using Oracle Application Express 5.1.
Time to Complete
Approximately 20 minutes
Background
Oracle Application Express is a rapid web application development tool for the Oracle Database. Using only a web browser and limited programming experience, you can develop and deploy professional applications that are both fast and secure. Oracle Application Express is available with the Oracle Database, whether it's on-premises or in the Oracle Cloud.
In this tutorial, you use Oracle Application Express Release 5.1 to create and run a database application. In release 5.1, charts in Oracle Application Express are powered by the Oracle JET charting library. Oracle JET charts are a component of the Oracle JavaScript Extension Toolkit (JET), an open source toolkit based on modern JavaScript, CSS3 and HTML5 design and development principles. Oracle JET charts are fast, highly customizable and versatile. Charts are fully HTML5 capable and work on any modern browser, regardless of platform, screen size, or features.
What Do You Need?
- Have access to an Oracle Database 11g or later release, either on-premises or in a Database Cloud Service.
- Install Oracle Application Express Release 5.1 into your Oracle Database (for on-premises only). If you are using Oracle Database Cloud Service, the application is already installed for you.
- Provision at least one Oracle Application
Express user. See Creating
New User Accounts in Oracle Application
Express Administration Guide.
- Have access to the HR tables. If necessary, download and install HR Sample Objects available from github.com.
-
Have the files.zip file downloaded and extracted into your working directory.
-
All files for this hands-on activity are located in the
Home/Desktop/APEX_Track/filesfolder. -
The following files are used in this hands-on activity:
f100.sql
-
Have the f100.sql application imported to your workspace along with the supporting objects.
-
The f100.sql application must be imported to your workspace along with the supporting objects.
Adding a Chart to a New Page
In this section, you create a Pie chart in a new page.
-
In the Application Express login page, enter the following login credentials and click Sign In:
-
Workspace: obe
-
Username: obe
-
Password: oracle
Description of this image -
-
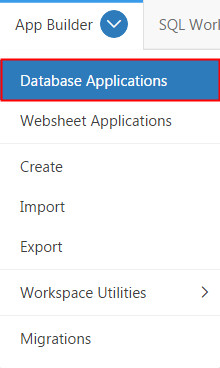
From the Oracle Application Express home page, click the down arrow next to the App Builder tab and choose Database Applications.
Description of this image -
Click Projects Tasks Application. This is the application you imported from the Files folder in the What Do You Need? section.
The application ID for the Project Tasks Application used in this tutorial is 100. You may see a different application ID when you perform this tutorial.

Description of this image -
Click Create Page.
Description of this image -
In the Create a Page modal window, click Chart.
Description of this image -
Select Pie for Chart Type.
Description of this image -
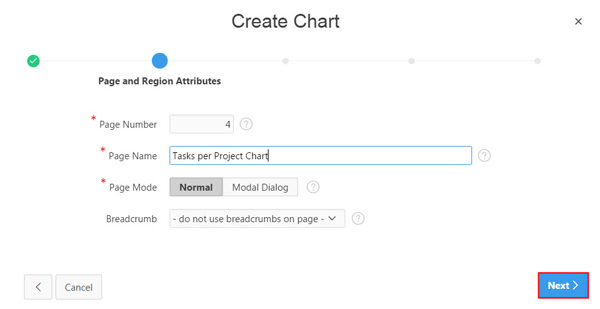
Enter Tasks per Project Chart for Page Name and click Next.
Description of this image -
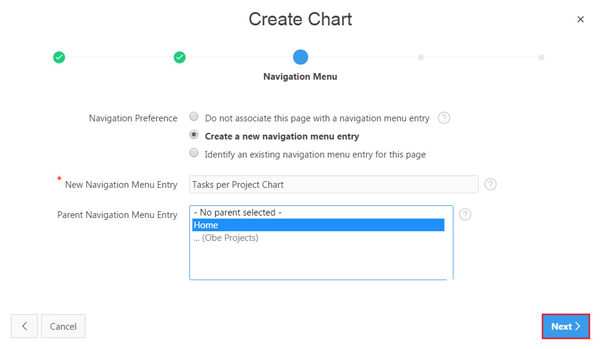
Select Create a new navigation menu entry for Navigation Preference, select Home for Parent Navigation Menu Entry, and click Next.
Description of this image -
In the Source Tab, select SQL Query for Source Type, enter the following in the SQL Query field, and click Next.
select null link,
       p.project label,
       t.task_count value
from (select project_id,
      count(*) task_count from obe_tasks group by project_id) t,
     obe_projects p
where t.project_id = p.project_id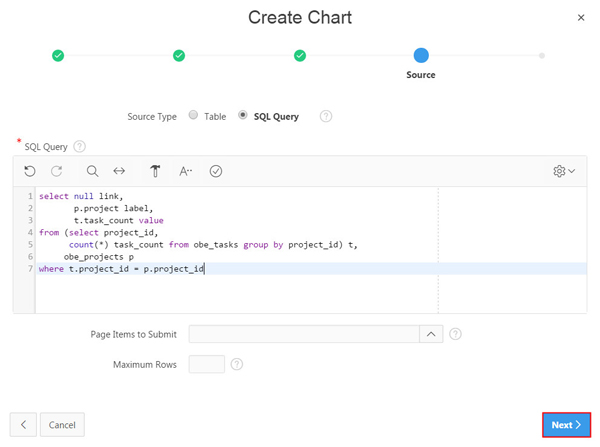
Description of this image -
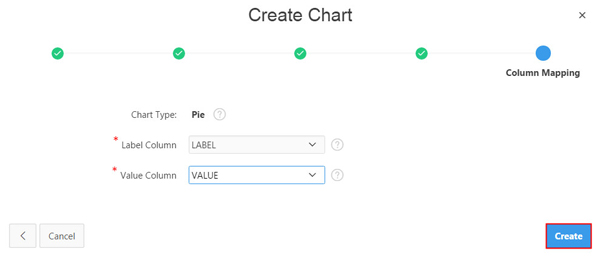
Select LABEL for Label Column, VALUE for Value Column, and click Create.
Description of this image -
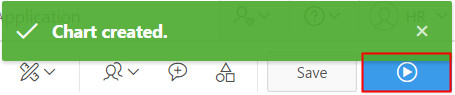
The new chart page is created. Click Save and Run Page.
Description of this image -
You may receive a Log In screen, where you must enter your Oracle Application Express credentials, and click Log In.
-
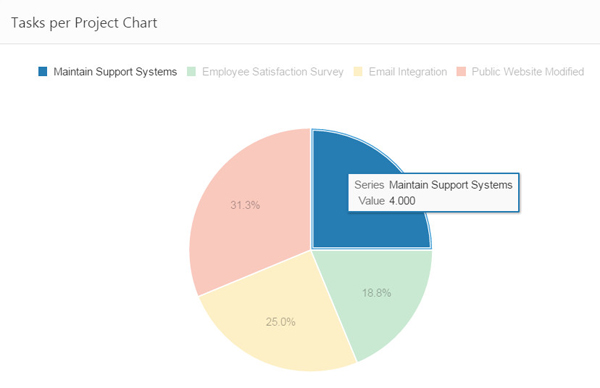
Observe the animation as the chart loads. The pie chart shows the numbers of tasks per project. Keep your mouse over the pie to display tool tip for the chart data. Also notice that the corresponding entry in the Legend getting highlighted while other entries fade out.
Description of this image -
Click Edit Page <n> in the developer toolbar.

Description of this image
Adding a Chart in Page Designer
In this section, you add a Bar chart to the an existing page by using Page Designer. You add the chart to the same page where you created the Pie chart (in the previous section).
-
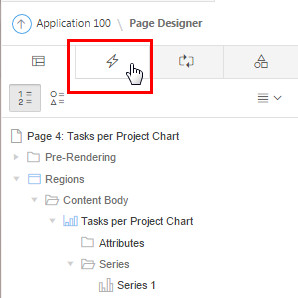
View the page in Page Designer. In this tutorial, the page 4 (Tasks per Project Chart) is opened in Page Designer.
-
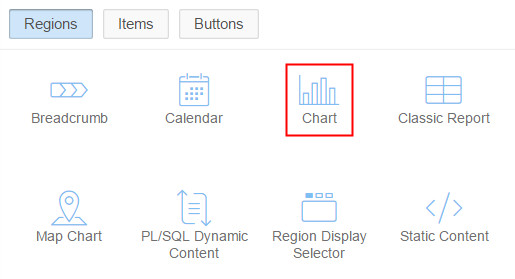
In the Gallery at the bottom of the central pane, click Regions and locate Chart.
Description of this image -
Right-click Chart in the Gallery to view a context menu. Select Add To, Content Body, Tasks per Project Chart and choose Column After.
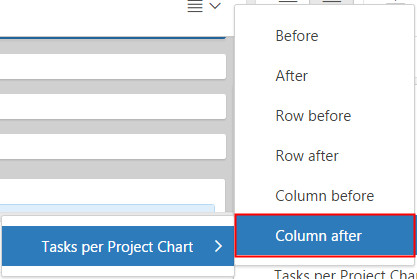
Description of this image Page Designer indicates what actions are required next.
-
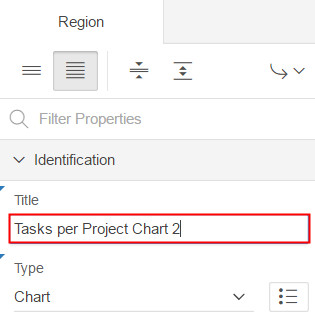
In the Region tab, enter Tasks per Project Chart 2 for Title and select the Attributes node in the Rendering tab.
Description of this image 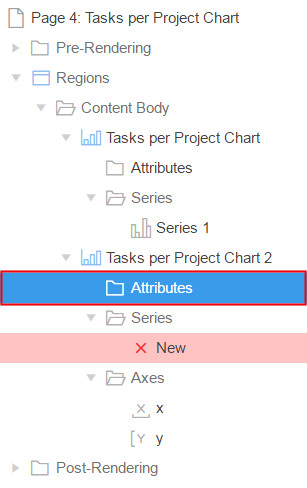
Description of this image -
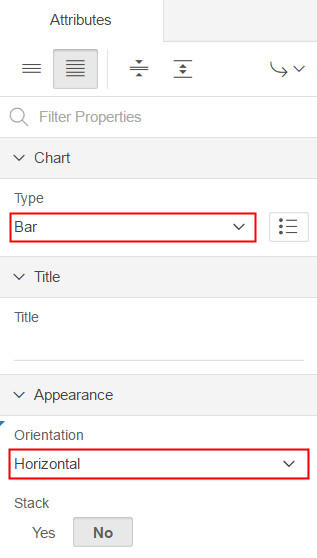
In the Attributes tab, select Bar for Type, Horizontal for Orientation and select the New node in the Rendering tab.
Description of this image 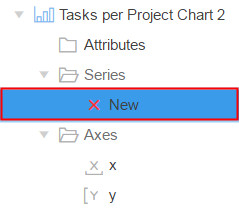
Description of this image -
In the Identification tab, enter Tasks for Name. In the Source tab, select SQL Query for Type and enter the following in the SQL Query field.
select null link,
       p.project label,
       t.task_count value
from (select project_id,
      count(*) task_count from obe_tasks group by project_id) t,
     obe_projects p
where t.project_id = p.project_id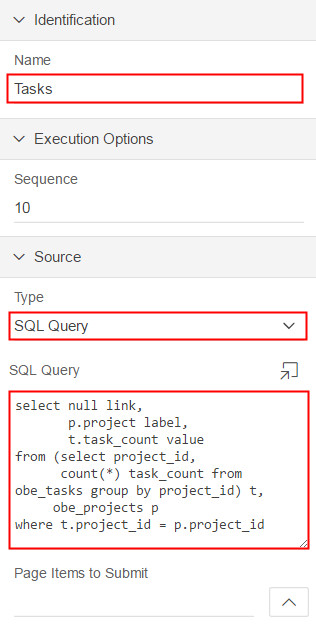
Description of this image -
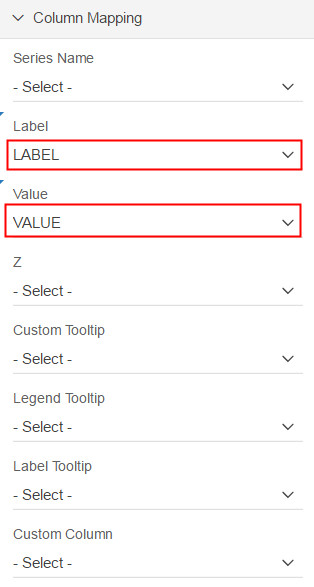
In the Column Mapping tab, select LABEL and VALUE for the Label and Value field respectively.
Description of this image -
Click Save and Run Page.

Description of this image -
You see the new chart added to the application.
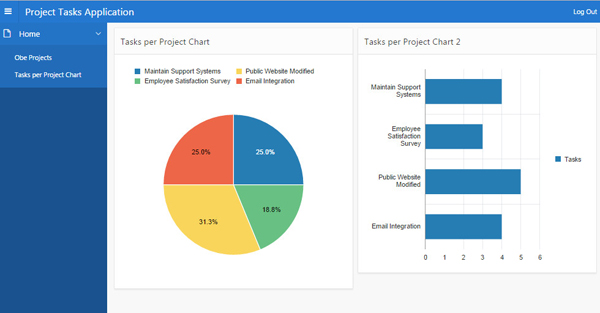
Description of this image
Editing Chart Attributes in Page Designer
In this section, you edit the attributes of a Bar chart using Page Designer.
-
View the page containing the Bar chart in the Page Designer. In this tutorial, the page 4 (Tasks per Project Chart) is opened in Page Designer.
Description of this image -
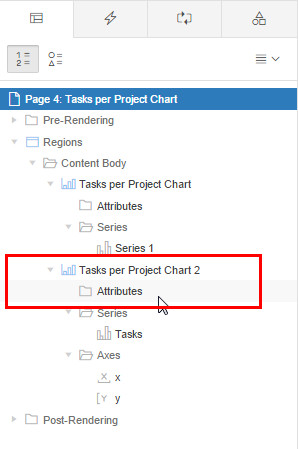
In the left pane, locate Tasks per Project Chart 2 in the Rendering tab and click the Attributes node under the chart.
Description of this image -
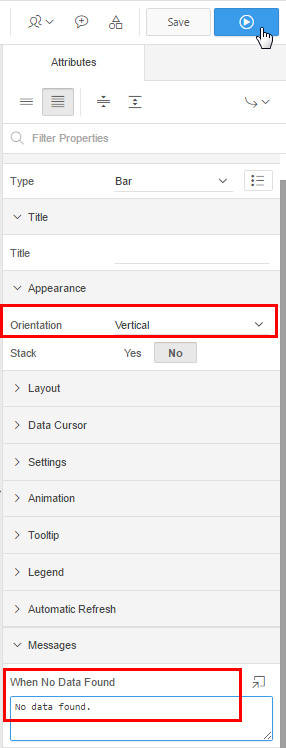
In the Appearance tab, select Vertical for orientation. In the Messages tab, enter No data found. for the When No Data Found field, and click Save and Run Page.
Description of this image -
You see that the edits made to the bar chart reflects in the application.
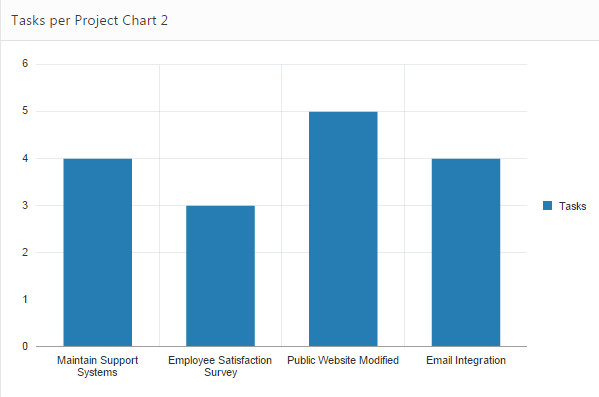
Description of this image
Switching a Chart Type in Page Designer
In this section, you switch a Bar chart to a Line chart by editing the chart attributes in Page Designer.
-
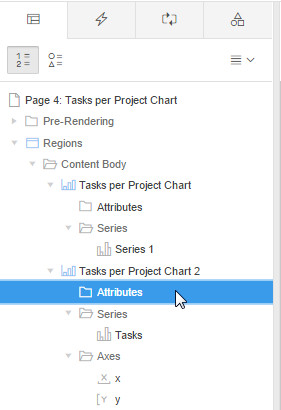
View the page in Page Designer. In this tutorial, the page 4 (Tasks per Project Chart) is opened in Page Designer.
Description of this image -
In the left pane, locate Tasks per Project Chart 2 in the Rendering tab and click the Attributes node under the chart. In this tutorial, chart attributes are already open in the Property Editor.
-
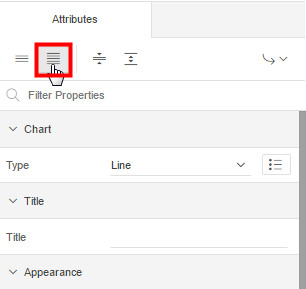
Expand the Chart section and select Line for Type.
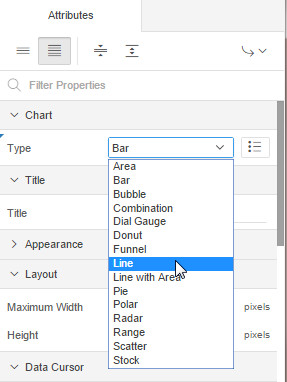
Description of this image Page Designer indicates what actions need to be performed to define required Column Mappings.
-
In the Rendering tab, select Tasks under the Series node.
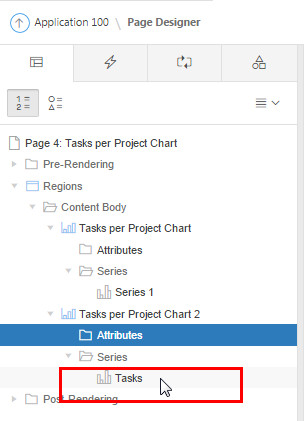
Description of this image -
In the Property Editor, navigate to the the Column Mapping tab. Select VALUE for Value, select LINK for Custom Tooltip, and VALUE for Custom Column.
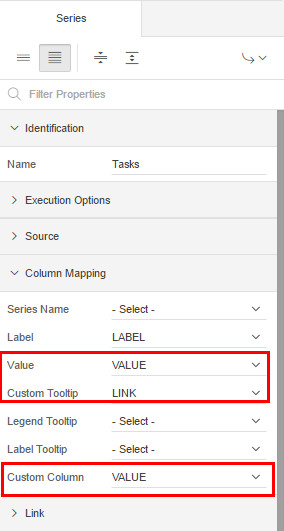
Description of this image -
In the Label tab, select Yes for Show and click Save and Run Page.
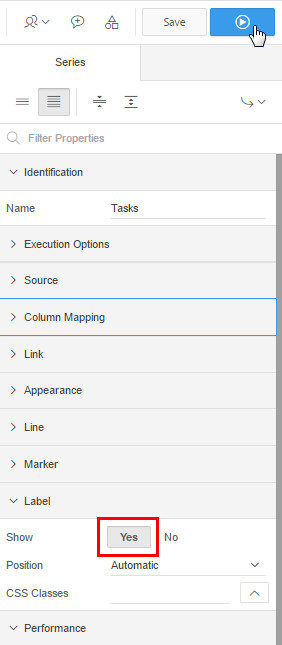
Description of this image -
You see a Line chart in place of the Bar chart in the application. Hover over a value to read the corresponding tooltip.
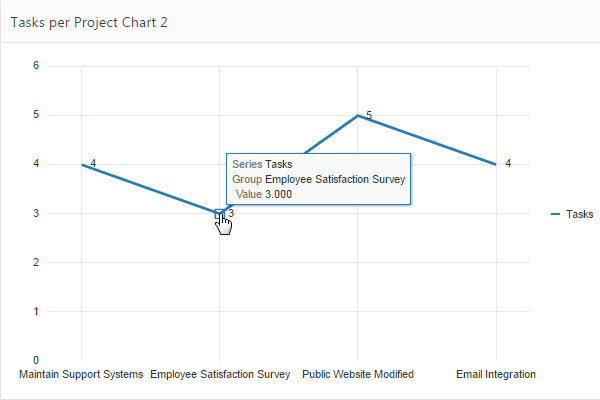
Description of this image
Creating a Dynamic Action to Refresh the Chart
Using Dynamic Actions, you specify an action that is performed when a defined set of conditions occur. You also specify which elements are affected by the action, and when and how they are affected. In this section, you create a dynamic action to refresh the chart when it's value changes.
-
View the page in Page Designer. In this tutorial, the page 4 (Tasks per Project Chart) is opened in Page Designer.
Description of this image -
In the left pane, Click the Dynamic Actions tab.
Description of this image -
Right-click Events and select Create Dynamic Action.
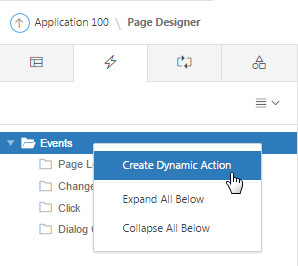
Description of this image Attributes for the dynamic action are displayed in the Property Editor.
-
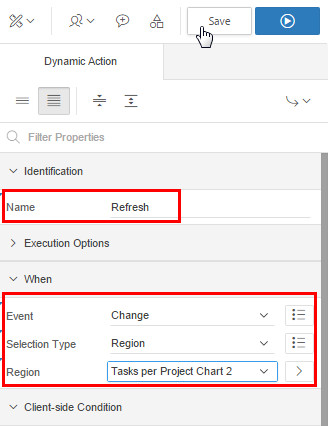
Edit the following Dynamic Action attributes in the Property Editor:
- In the Identification tab, enter Refresh as the name of the dynamic action.
- In the When tab, select Change for Event, select Region for Selection Type, and Tasks per Project Chart 2 for Region.
Description of this image -
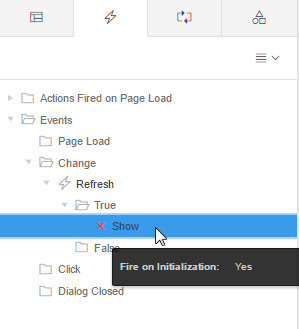
In the Rendering tab, select Show under True.
Description of this image -
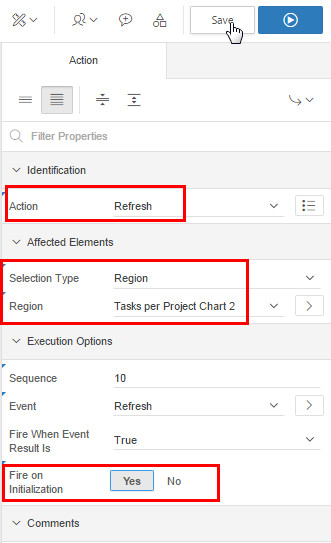
In the Property Editor, change the Action to Refresh. In the Affected Elements tab, select Region for Selection Type and Tasks per Project Chart 2 for Region. In the Execution Options tab, select Yes for Fire on Initialization and click Save.
Description of this image -
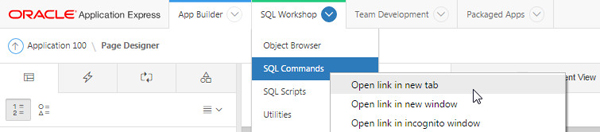
In the main navigation, click the down arrow next to the SQL Workshop tab, right-click SQL Commands and select Open link in new tab.
Description of this image -
Enter the following code in the code box and click Run.
Insert into OBE_TASKS VALUES
        ( 17
        , 'Employee Satisfaction Survey'
        , 'Complete analysis'
        , TO_DATE('30-JAN-2005', 'dd-MON-yyyy')
        , TO_DATE('03-FEB-2005', 'dd-MON-yyyy')
	, 'open'
        , 4
        , 2
	);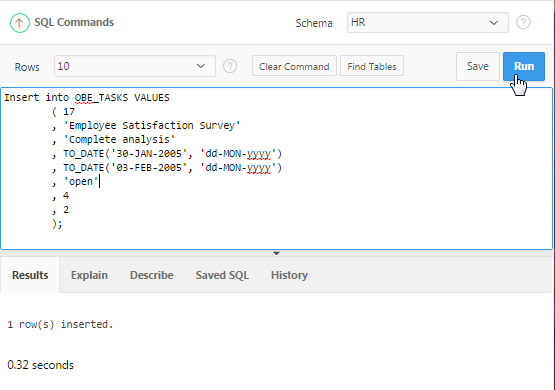
Description of this image -
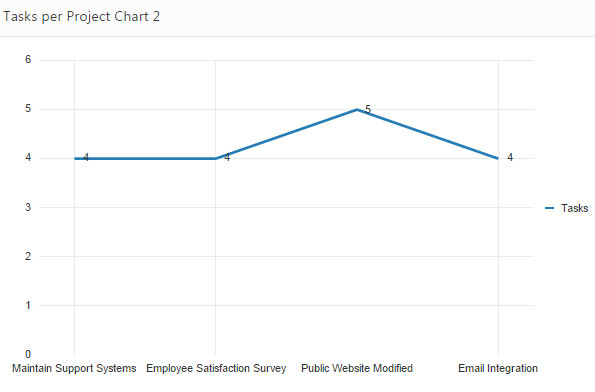
Switch back to the charts window. You will see the Refresh dynamic action that we created in the previous steps has updated the number of tasks for Employee Satisfaction Survey to 4 in the Tasks per Project Chart 2 chart.
Description of this image
Using a Custom JavaScript in the Chart
In this section, you add a JavaScript to change the appearance of an existing chart.
-
View the page in Page Designer. In this tutorial, the page 4 (Tasks per Project Chart) is opened in Page Designer.
Description of this image -
In the Rendering tree, select the Attributes node.
Description of this image -
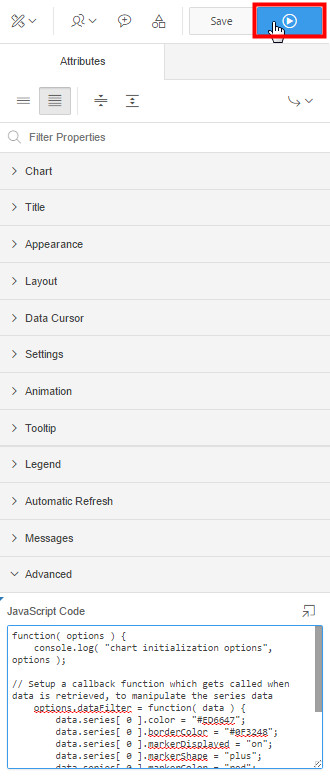
To view all attributes in the Property Editor, click Show All to see all attributes for the chart.
Description of this image -
In the Advanced tab, enter the following code in the JavaScript code box.
function( options ) {
    console.log( "chart initialization options", options );

// Setup a callback function which gets called when data is retrieved, to manipulate the series data
    options.dataFilter = function( data ) {
        data.series[ 0 ].color = "#ED6647";
        data.series[ 0 ].borderColor = "#0F3248";
        data.series[ 0 ].markerDisplayed = "on";
        data.series[ 0 ].markerShape = "plus";
        data.series[ 0 ].markerColor = "red";
        data.series[ 0 ].markerSize = 8;
        data.series[ 0 ].pattern = "smallChecker";
        return data;
    };
    return options;
}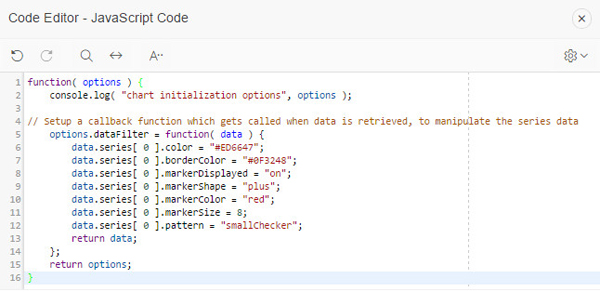
Description of this image -
Click Save and Run Page.
Description of this image -
You see the JavaScript code has customized the appearance of the chart while rendering.
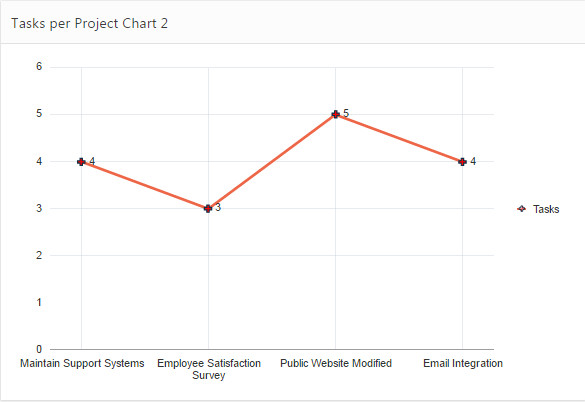
Description of this image